New ebook – Geospatial Data Analysis with Python : GIS မြေပုံရေးဆွဲနည်း နှင့် သဘာဝဘေးအန္တရာယ် စီမံခန့်ခွဲမှုဆိုင်ရာ ဂြိုဟ်တုပုံရိပ်များ ခွဲခြမ်းစိတ်ဖြာခြင်း
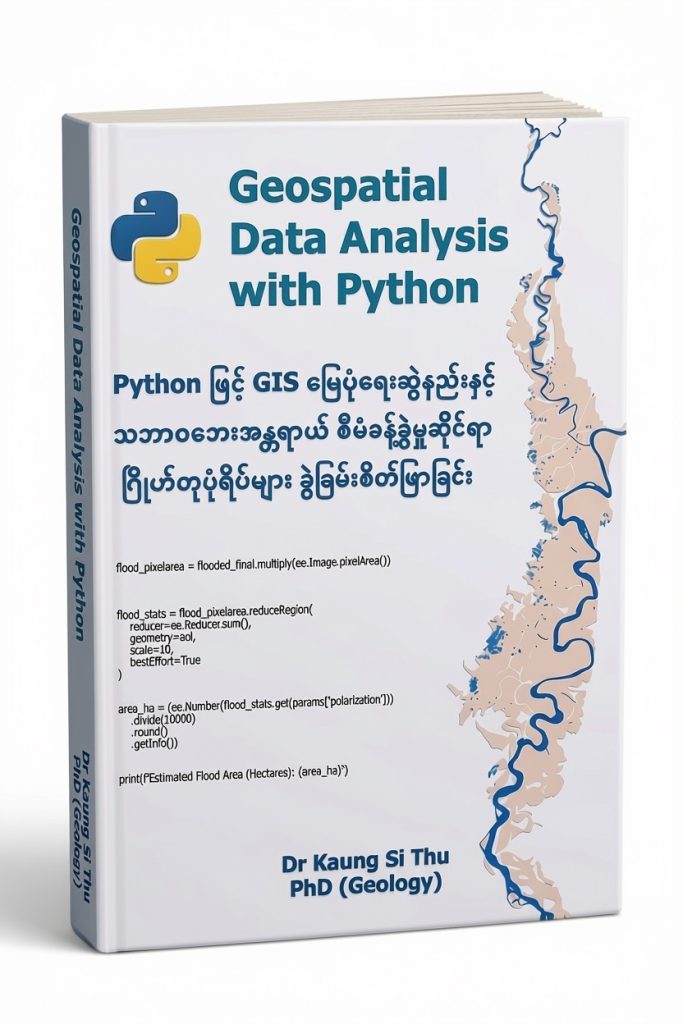
ယခု စာအုပ်သည် GIS နယ်ပယ်တွင် Python Programming ဖြင့် GIS မြေပုံများဖန်တီးရေးဆွဲပြီး သဘာဝအန္တရာယ်ဆိုင်ရာ ဂြိုဟ်တုပုံရိပ်များ ခွဲခြမ်းစိတ်ဖြာနည်းများကို အသေးစိတ် ဖော်ပြထားသည့် လက်စွဲစာအုပ်ဖြစ်သည်။ သင်ခန်းစာများတွင် Python အခြေခံမှစ၍ GeoPandas, Rasterio, Matplotlib နှင့် Folium ကဲ့သို့သော အဆင့်မြင့် Geospatial libraries များကို အသုံးပြုပုံများကို အဆင့်ဆင့် လေ့လာရမည်ဖြစ်သည်။ Shapefile, GeoJSON, GeoTIFF စသည့် Data Format များကို စီမံခန့်ခွဲခြင်းနှင့် Spatial Analysis ပြုလုပ်ခြင်း၊ Satellite image များကို အသုံးပြု၍ NDVI, NDWI ကဲ့သို့သော Spectral indices များ တွက်ချက်ခြင်း၊ DEM data များကို အသုံးပြုပြီး မြေမျက်နှာသွင်ပြင် (Terrain analysis) ဆန်းစစ်ခြင်း၊ Interactive Web Map များ ဖန်တီးခြင်း၊ Google Earth Engine (GEE) Python API ဖြင့် Cloud-based satellite data များကို ခွဲခြမ်းစိတ်ဖြာခြင်းနှင့် Geospatial Web Applications တည်ဆောက်နည်းများကို အသေးစိတ် လေ့လာရပါမည်။
GIS / Remote Sensing နယ်ပယ်တွင် သုတေသနပြုလုပ်နေသူများ၊ Data analysis နှင့် Mapping လုပ်ဆောင်လိုသူများ၊ Web GIS နှင့် Geospatial application development ပိုင်းကို စတင်လေ့လာလိုသူများအတွက် ဤစာအုပ်သည် အထူးသင့်လျော်ပါသည်။ ဤစာအုပ်သည် သီအိုရီသက်သက်မဟုတ်ဘဲ Google Colab ပတ်ဝန်းကျင်တွင် လက်တွေ့လုပ်ဆောင်နိုင်သည့် လေ့ကျင့်ခန်းများဖြင့် ဖွဲ့စည်းထားသောကြောင့် သင်တန်းပြီးဆုံးချိန်တွင် Geospatial data များကို Python ဖြင့် အလိုအလျောက် ခွဲခြမ်းစိတ်ဖြာနိုင်ခြင်း၊ Interactive maps များ ဖန်တီးနိုင်ခြင်းနှင့် ကိုယ်ပိုင် Geospatial web applications များ တည်ဆောက်နိုင်သည့် အရည်အချင်းများ ရရှိလာမည်ဖြစ်သည်။ အချုပ်အားဖြင့်ဆိုရသော် ဤစာအုပ်သည် Python ကိုအသုံးပြု၍ ခေတ်မီ GIS နည်းပညာများကို လက်တွေ့အသုံးချလိုသူတိုင်းအတွက် မရှိမဖြစ်လိုအပ်သော လမ်းညွှန်ချက်တစ်ခု ဖြစ်ပါသည်။
စာအုပ်တွင် ပါဝင်သော သင်ခန်းစာများကို စာတွေ့သာမက လက်တွေ့ပါ တပါတည်း လိုက်နာဆောင်ရွက်နိုင်ရန်အတွက် လိုအပ်သော Spatial Data များကိုလည်း အပြည့်အစုံ ထောက်ပံ့ပေးသွားမည် ဖြစ်ပါသည်။ Pre-order တင်ထားသူများ၏ Email များသို့ ၂၀၂၆ ခုနှစ်၊ ဩဂုတ်လ (၁၆) ရက်နေ့မှ စတင်ကာ Geospatial Data Analysis with Python : GIS မြေပုံရေးဆွဲနည်း နှင့် သဘာဝဘေးအန္တရာယ်ဆိုင်ရာ ဂြိုဟ်တုပုံရိပ်များ ခွဲခြမ်းစိတ်ဖြာခြင်း (E-book) နှင့် လေ့ကျင့်ခန်းဒေတာများကို ပေးပို့သွားမည် ဖြစ်ပါသည်။ Pre-order တင်ထားသည့် ပထမဆုံးလူဦးရေ (၂၀) ဦး အတွက် “Python for Geospatial Analysis & Remote Sensing” အွန်လိုင်းသင်တန်းကို အခမဲ့ (Free Access) တက်ရောက်ခွင့်ပေးထားပါသည်။
Python GIS (Ebook) Order မှာယူရန်
မာတိကာ
အခန်း (၁) – Python Programming မိတ်ဆက်
- Python ဆိုတာ ဘာလဲ။
- Geospatial Data Analysis နှင့် မြေပုံရေးဆွဲခြင်း လုပ်ငန်းစဉ်များတွင် ဘာကြောင့် Python ကို မရှိမဖြစ် အသုံးပြုလာကြသလဲ။
- Google Colab မိတ်ဆက်
- Python အခြေခံ အရေးအသားနှင့် Variables များ
အခန်း (၂) – Data Types and Data Structures
- အခြေခံ Data Types များ (Core Data Types: Numbers, Strings, Booleans)
- Data Structures အချက်အလက် ဖွဲ့စည်းတည်ဆောက်ပုံများ (Lists, Dictionaries, Tuples, Sets)
- Data Type တစ်ခုနှင့်တစ်ခု ပြောင်းလဲခြင်း (Type Casting / Conversion)
- အချက်အလက်များကို ရွေးချယ်ထုတ်ယူခြင်းနှင့် ဖြတ်တောက်ခြင်း (Indexing and Slicing)
- List နှင့် Dictionary ကို အသုံးပြု၍ Geospatial Data (ဥပမာ – GeoJSON) များ ဖွဲ့စည်းတည်ဆောက်ပုံကို လေ့လာခြင်း
အခန်း (၃) – Conditional Statements, Loops and Functions
- If, Elif, Else အသုံးပြု၍ ဆုံးဖြတ်ချက်ချခြင်း
- Logical Operators (
and,or,not) - For Loop နှင့် While Loop အသုံးပြုခြင်း
- Functions များ ဖန်တီးခြင်း
- Function Arguments နှင့် Return Values
- GIS လုပ်ငန်းစဉ်များတွင် ပေါင်းစပ်အသုံးပြုခြင်း
အခန်း (၄) – Geospatial Vector Data များ စီမံခန့်ခွဲခြင်း၊ ခွဲခြမ်းစိတ်ဖြာခြင်းနှင့် မြေပုံရေးဆွဲခြင်း
- Mapping and Data Visualization Libraries များ မိတ်ဆက်
- Pandas နှင့် Data Structures များ
- GeoPandas နှင့် Core Data Structures များ
- GeoPandas အသုံးပြု၍ Geospatial Data များ ဖတ်ခြင်း
- Map Projection နှင့် CRS ပြောင်းလဲခြင်း
- Spatial Operations များ (Buffer, Clip, Intersect)
- မြေပုံရေးဆွဲခြင်း Tools များ (Mapping and Plotting Tools)
- GeoPandas နှင့် Matplotlib အသုံးပြု၍ Map Layer များ ထပ်ခြင်း
- အခြေခံမြေပုံများ ရေးဆွဲခြင်း
- Choropleth မြေပုံများ ဖန်တီးခြင်း
- ဒေတာအလွှာမျိုးစုံပါဝင်သော မြေပုံများဖန်တီးခြင်း (Multi-Layers Map)
- ငလျင်ဆိုင်ရာ အချက်အလက်များ ခွဲခြမ်းစိတ်ဖြာခြင်းနှင့် မြေပုံထုတ်ခြင်း
အခန်း (၅) – Geospatial Raster Data များ စီမံခန့်ခွဲခြင်း၊ ခွဲခြမ်းစိတ်ဖြာခြင်းနှင့် မြေပုံရေးဆွဲခြင်း
- Raster Data ၏ သဘောတရားနှင့် တည်ဆောက်ပုံ (Pixels, Bands, Resolution)
- Rasterio Library မိတ်ဆက်နှင့် Raster Data များ ဖတ်ရှုခြင်း
- NumPy ကို အသုံးပြု၍ Raster Data များအား Matrix (Array) ပုံစံဖြင့် ကိုင်တွယ်ခြင်း
- Coordinate Reference Systems (CRS) သတ်မှတ်ခြင်းနှင့် မြေပြင်အနေအထားနှင့် ကိုက်ညီအောင် ပြောင်းလဲခြင်း
- Spatial Operations များ (Resampling, Reprojection)
- Surface Analysis လုပ်ဆောင်ခြင်း (Slope, Aspect, Hillshade တွက်ချက်ခြင်း)
- Digital Elevation Model (DEM) ကိုင်တွယ်ခြင်း
- Zonal Statistics များ (Raster နှင့် Vector Data များ ပေါင်းစပ်တွက်ချက်ခြင်း)
- Visualizing ပြုလုပ်ခြင်း (Colormaps, Stretching)
- Data များ ပြန်လည်သိမ်းဆည်းခြင်း (Exporting)
အခန်း (၆) – Interactive Mapping
- Interactive Web Maps ဖန်တီးခြင်း အခြေခံ သဘောတရားများ
- Interactive Map ဖန်တီးခြင်းအတွက် အခြေခံ Syntax များ
- Folium Library အသုံးပြု၍ မြေပုံအခြေခံများ တည်ဆောက်ခြင်း
- Folium အသုံးပြု၍ Custom Markers, Polylines နှင့် Polygons များ ရေးဆွဲခြင်း
- Layer Control အသုံးပြု၍ မြေပုံပေါ်တွင် အလွှာများ (Layers) အပြန်အလှန်ပြောင်းလဲခြင်း
- Popups နှင့် Tooltips များ အသုံးပြု၍ Spatial Data များအား အပြန်အလှန်ထိတွေ့နိုင်သော (Interactive) ပုံစံဖြင့် ပြသခြင်း
- Tile Layers များ ပြောင်းလဲအသုံးပြုခြင်း (OpenStreetMap, Satellite, Topographic)
- GeoPandas နှင့် Folium ကို ပေါင်းစပ်၍ Geospatial Data များအား Interactive Map ပေါ်တွင် ထည့်သွင်းခြင်း
- မြေပုံပေါ်တွင် အတိုင်းအတာကိရိယာများ (Measure Tools) နှင့် Geocoding ထည့်သွင်းခြင်း
အခန်း (၇) – Cloud-based Remote Sensing with Google Earth Engine (GEE)
- Google Earth Engine Python API မိတ်ဆက်
- Google Earth Engine (GEE) ၏ အခြေခံသဘောတရားနှင့် Cloud-based စွမ်းဆောင်ရည်များ
- GEE Python API အသုံးပြုနိုင်ရန်အတွက် လိုအပ်သော Setup နှင့် Authentication ပြုလုပ်ခြင်း
- Image နှင့် ImageCollection များအား ရှာဖွေခြင်းနှင့် Filter ပြုလုပ်ခြင်း (Filtering by date, bounds)
- Landsat 8 နှင့် Sentinel-2 ဂြိုဟ်တုပုံရိပ်များကို visualization ပြုလုပ်ခြင်း
- Time Series Data များ ကိုင်တွယ်ခြင်းနှင့် ခွဲခြမ်းစိတ်ဖြာခြင်း
- Remote Sensing Indices များ (NDVI, NDWI) တွက်ချက်ခြင်း
- Climate Data များ Processing ပြုလုပ်ခြင်း
- Sentinel-1 imagery အသုံးပြု၍ မြေပြင်အနေအထားပြောင်းလဲမှုများကို ထောက်လှမ်းခြင်း (Detecting Changes in Sentinel-1 Imagery)
အခန်း (၈) – Radar-based Flood Mapping
- Sentinel-1 SAR Data မိတ်ဆက်
- Flood Mapping အတွက် Sentinel-1 Ground Range Detected (GRD) ပုံရိပ်များ ရှာဖွေခြင်း
- Radar Image Pre-processing
- Flood Detection Workflow (Thresholding နည်းလမ်းဖြင့် ရေလွှမ်းမိုးမှုဧရိယာများကို ခွဲခြားခြင်း)
- ရေလွှမ်းမိုးမှုဧရိယာ (Inundation Map) ထုတ်ယူခြင်း
- Post-processing and Validation
- ရေလွှမ်းမိုးမှုဧရိယာကို Vector (Shapefile) ပုံစံသို့ ပြောင်းလဲခြင်း
- ရေလွှမ်းမိုးမှုဆိုင်ရာ GIS မြေပုံများ ဖန်တီးခြင်းနှင့် လက်တွေ့အသုံးချခြင်း
အခန်း (၉) – Geospatial Web Application တည်ဆောက်ခြင်း
- Streamlit မိတ်ဆက် နှင့် Web Application တည်ဆောက်ရန် Setup ပြုလုပ်ခြင်း
- Interactive Map များ Web Application ပေါ်တွင် ပြသခြင်း
- ငလျင်ဆိုင်ရာအချက်အလက်များကို Visualization ပြုလုပ်ခြင်း
- Bar Chart များ ဖန်တီး၍ Data Visualization ပြုလုပ်ခြင်း
- Scatter Chart များ အသုံးပြု၍ Data Relationship များ Visualization ပြုလုပ်ခြင်း
- Line Chart များ အသုံးပြု၍ Time-Series Data များ Visualization ပြုလုပ်ခြင်း
- Streamlit Page Layout သတ်မှတ်ခြင်း
- Sidebar Components များ ထည့်သွင်းအသုံးပြုခြင်း
- Dashboard အဖြစ် တည်ဆောက်ခြင်း
- Streamlit Cloud တွင် Web Application Deploy ပြုလုပ်ခြင်း
Copyright © 2026 by Dr. Kaung Si Thu. All rights reserved.